


Data and visualization contract
DFC Bridge treats data display as a product contract, not as sample copy arranged in rectangles. A transferable design states what the data means, where it comes from, how it is formatted, which operations users can perform, and what happens when the ideal dataset is unavailable.
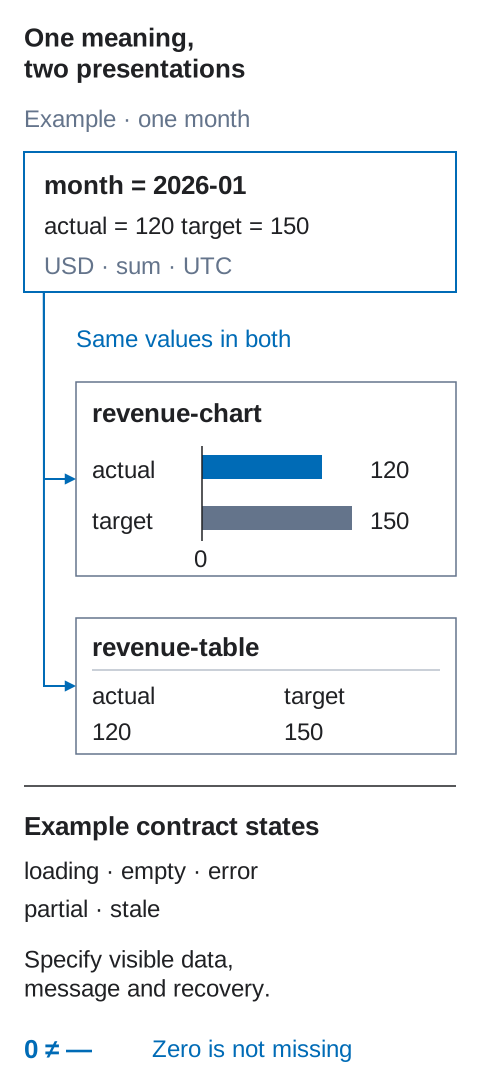
One semantic dataset may have several declared presentations. Formatting and responsive composition must not change its meaning.
What belongs in the contract
Section titled “What belongs in the contract”Start with the question a table, grid, metric, list, or chart must answer. Then use the following decisions to define its data, presentation, and failure cases:
| Concern | Required decision |
|---|---|
| Purpose | The question the display answers and the decision it supports. |
| Schema | Field keys, value types, nullable values, identifiers, and relationships. |
| Cardinality | Minimum, typical, maximum, pagination/windowing, and whether the total is known. |
| Provenance | Source system or owner, aggregation method, refresh time, and freshness/staleness rule. |
| Presentation | Column/series meaning, order, grouping, sorting, filtering, comparison baseline, and precision. |
| Format | Locale, time zone, currency, units, sign, rounding, missing-value marker, and date/number notation. |
| States | Loading, empty, error, partial, stale, offline, and unauthorized behavior. |
| Responsive | Same-tree behavior or a declared transformation with semantic parity. |
| Accessibility | Name, description, headers/relationships, keyboard operation, and a non-visual equivalent. |
| Trust | Data limitations, estimates, sample size, privacy/suppression rules, and last-updated information. |
Sample values in Figma are fixtures. They are not the schema, maximum length, precision rule, or runtime source of truth.
Roles: content, data display, and controls
Section titled “Roles: content, data display, and controls”- Content is authored product copy: a title, explanation, footnote, or annotation.
- Runtime data is supplied by a service, CMS, calculation, sensor, or user input.
- Data display maps runtime data to a table, grid, metric, list, map, or chart.
- Controls change the query or presentation: filter, sort, date range, pagination, drill-down, or series visibility.
- Provenance tells users and implementers why a value can be trusted and how current it is.
Keep these roles distinct. A chart title is not a data field; a highlighted maximum is not a new value; a filter chip is not part of the result collection.
Use short layer tags, keep the rich contract structured
Section titled “Use short layer tags, keep the rich contract structured”Layer names and existing DFC Bridge tags should expose only the anchors a reviewer needs in the design:
revenue [section=revenue-overview] period-filter revenue-chart revenue-table data-statusDo not encode the entire schema in names such as [series-revenue], [currency-usd], [timezone-utc], and dozens of similar tags. Attach or export one structured contract keyed by revenue-chart:
Non-standalone module fragment. This excerpt shows only
bridge.dataand intentionally omits required envelope fields. Insert it into the requiredbridgeenvelope from the transfer contract before exchange or full-contract validation.
{ "bridge": { "data": { "displays": [{ "displayId": "revenue-chart", "purpose": "Compare recognized revenue with target by month", "source": { "owner": "finance-analytics", "dataset": "recognized-revenue", "refresh": "daily", "staleAfter": "PT36H" }, "dimensions": [{ "key": "month", "type": "year-month", "timeZone": "UTC" }], "measures": [ { "key": "actual", "type": "decimal", "currency": "USD", "aggregation": "sum" }, { "key": "target", "type": "decimal", "currency": "USD", "aggregation": "sum" } ], "format": { "locale": "user", "notation": "compact", "maximumFractionDigits": 1 }, "states": ["loading", "empty", "error", "partial", "stale"], "accessibleEquivalent": "revenue-table" }] } }}In this example, revenue-chart and revenue-table expose the same actual/target values. Changing period-filter also needs a reaction: what loads, what stays visible, and how failure is reported. The data record alone does not define that interaction.
Structured metadata is versionable, reviewable, and target-independent. It may live in Figma plugin data, a sidecar file, or an adapter payload, but it must reference stable DFC Bridge identities and travel with the handoff.
Tables
Section titled “Tables”A data table contract declares:
- caption or accessible name and, when useful, a short summary;
- row identity and column keys;
- header scope, grouped headers, and relationships between header and data cells;
- default sort and whether sorting is client- or server-side;
- filter semantics, active-filter announcement, and reset behavior;
- pagination, infinite loading, or virtualization, including total-count behavior;
- selection model, bulk-action scope, and persistence across pages;
- editable-cell validation and save/revert behavior;
- overflow behavior at narrow widths without hiding essential fields silently.
Use a semantic table when users compare values across rows and columns. A visual card layout is not a reason to discard the relationships. Follow the WAI tables tutorial for header association patterns.
Grids, lists, and repeated cards
Section titled “Grids, lists, and repeated cards”Declare the item schema independently of how many fixtures fit a Figma frame. Specify stable item identity, ordering, grouping, minimum/maximum/unknown counts, pagination, duplicates, missing media, and long or localized values.
A responsive column change does not change cardinality:
product-grid product-card-oak-chair product-card-wool-lamp product-card-steel-desk product-card-cork-stoolThese are stable design fixture instance keys, not array positions and not runtime database ids. A repeated data item has separate identities: templateKey for the reusable card, designInstanceKey for the authored fixture, and runtimeDataKey (or another product record key) for reconciliation after sorting, filtering, pagination, and live updates. The structured mapping—not a -1, -2 layer suffix—defines the relationship. Never expose a confidential backend identifier merely to satisfy the contract.
If mobile deliberately loads a different window of records, the query/pagination contract must say so. Do not delete fixture cards merely to produce a full final row.
Charts and maps
Section titled “Charts and maps”Every chart contract states:
- the analytical question and suitable chart form;
- dimensions, measures, units, domains, aggregation, baseline, and ordering;
- the complete scale behavior, including zero baseline when required and treatment of outliers;
- the meaning of color, shape, line style, size, and annotation;
- hover, focus, selection, zoom, pan, drill-down, and reset behavior;
- tooltip content and formatting;
- an accessible name and concise summary of the principal pattern;
- access to the values through a data table, list, or downloadable equivalent.
Never communicate a series or status by color alone. Ensure labels and marks meet applicable contrast requirements, keep tooltips reachable by keyboard and pointer, and do not make a canvas/SVG picture the only representation of the information. The WAI images tutorial on complex images describes text alternatives for charts and diagrams.
Formats are semantics
Section titled “Formats are semantics”Declare locale-sensitive formatting rather than copying visible punctuation:
- a currency value includes currency and currency-display policy;
- a percentage distinguishes
0.25from25; - a measurement includes the unit and conversion/rounding policy;
- a timestamp includes source zone, display zone, daylight-saving behavior, and granularity;
- a range defines inclusivity and start/end semantics;
- missing, zero, suppressed, estimated, and not-applicable values use different states when they mean different things.
Do not let compact notation, rounding, or truncation make totals contradictory. Full precision should remain available where users need it.
Required data states
Section titled “Required data states”| State | Contract question |
|---|---|
| Loading | Is previous data retained? Is progress determinate? What is announced? |
| Empty | Is the query valid but has no results? What recovery action exists? |
| Error | Which operation failed, what remains usable, and can it be retried? |
| Partial | Which subset is missing, and may the user act on incomplete results? |
| Stale | How old is it, why is it shown, and how is refresh requested? |
| Offline | What is cached, what action is queued, and how is reconnection reported? |
| Unauthorized | Is content hidden, redacted, or replaced by a permission request? |
Skeletons must resemble eventual structure without pretending to be real content. A live update must preserve focus and selection and be announced only when it materially affects the user.
Responsive data transformations
Section titled “Responsive data transformations”Same logical tree is the default. Tables may scroll, columns may resize, charts may reflow, legends may move, and labels may wrap without a structural exception.
When the usable presentation truly changes—table to cards, multi-series chart to small multiples, or inline details to disclosure—declare a responsive transformation. It must record:
- source and resulting identities;
- container or viewport condition;
- field/series mapping with no silent loss of meaning;
- reading, focus, and action order;
- location of omitted details and how users reach them;
- state, selection, filter, and URL/history preservation;
- accessible equivalent in every presentation.
A smaller screen is not permission to remove comparison fields, provenance, or recovery actions. See Responsive breakpoints.
Data review gate
Section titled “Data review gate”Use these questions to review the data-display contract. This is not a page-wide Ready result or proof of the implemented application:
- Can we implement it with zero invented fields or formats?
- Do fixtures cover zero, one, typical, maximum, long, missing, stale, partial, and failed data?
- Are source, refresh, units, precision, and time zone explicit?
- Do sorting, filtering, pagination, selection, and drill-down have complete reactions and states?
- Does the narrow presentation preserve meaning and task completion?
- Can a keyboard or screen-reader user obtain the same values and conclusions?
- Are privacy, suppression, estimates, and limitations visible where needed?